|
Getting your Trinity Audio player ready...
|
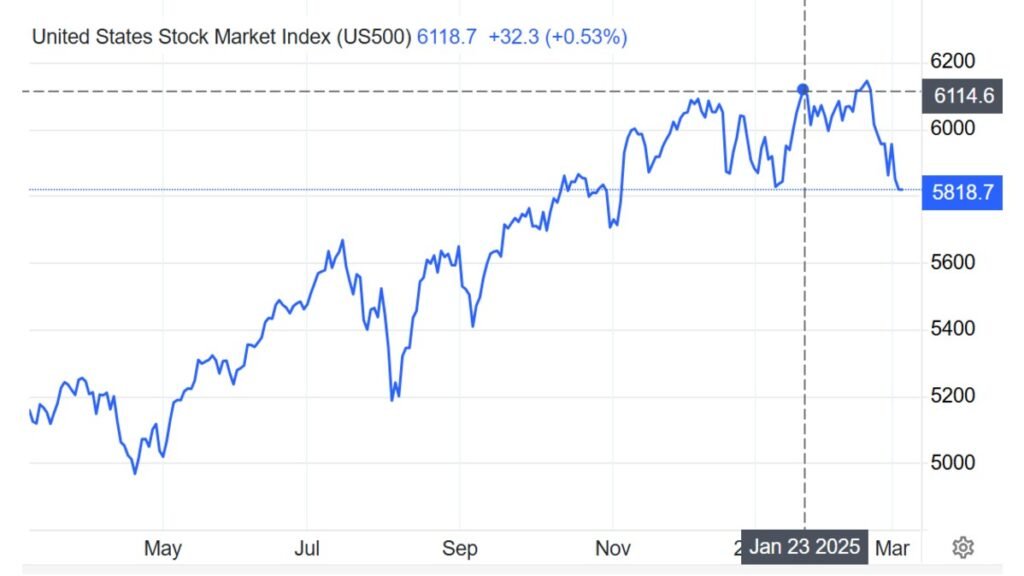
The US-500 index, often seen as a barometer of the American stock market, encapsulates the performance of 500 of the largest publicly traded companies in the United States. This benchmark index, formally known as the S&P 500, serves as a crucial indicator for investors, policymakers, and economic analysts worldwide. However, in recent years, the US-500 has faced significant volatility, reacting to global crises, geopolitical tensions, and shifts in US political leadership.
What Is the US-500 and How Is It Calculated?
The US-500 is a capitalization-weighted index, meaning that companies with higher market values exert greater influence on its overall performance. The calculation involves multiplying a company’s share price by the number of outstanding shares and then normalizing the total market capitalization by an index divisor. This ensures that stock splits, dividends, and other corporate actions do not distort the index’s movement.
Managed by S&P Dow Jones Indices, the selection of companies within the index is based on various factors, including liquidity, industry representation, and financial viability. Sectors such as technology, healthcare, and finance typically hold the most weight, with major players like Apple, Microsoft, and JPMorgan Chase steering the index’s trajectory.
Who Can Invest in the US-500?
Investors in the US-500 range from institutional giants to retail traders. Hedge funds, pension funds, and mutual funds often use the index as a benchmark for portfolio performance. Additionally, exchange-traded funds (ETFs) like SPDR S&P 500 ETF Trust (SPY) allow individual investors to gain exposure to the index without buying each stock separately. International investors also allocate significant capital into the US-500, considering it a representation of the strength and stability of the US economy. However, recent events have cast doubts on that very stability.
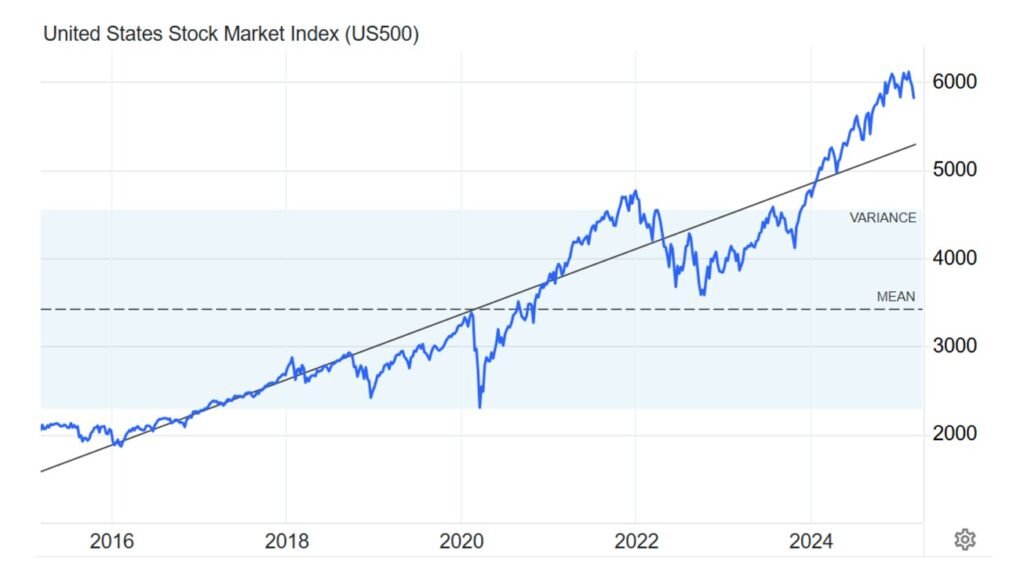
A Decade of US-500 Movements: From 2015 to 2025
The US-500 has historically reflected the macroeconomic landscape, responding to major events with dramatic movements.
2015–2016: Moderation and Transition
- Trends: The index saw modest growth, though it experienced short-lived pullbacks due to a slowdown in China and global economic concerns. The US Federal Reserve’s plans to raise interest rates prompted caution.
- Why It Moved:
- Chinese Economic Slowdown: Weaker demand caused anxiety, hitting export-reliant sectors.
- Rate Hike Anticipation: Higher borrowing costs tempered investment flows, especially in riskier assets.
2017–2018: Trump Rally and Trade Concerns
- Trends: After Donald Trump’s 2016 election, the market rose on hopes for tax reforms and deregulation. By 2018, this optimism gave way to volatility as trade tensions flared with China.
- Why It Moved:
- Corporate Tax Overhaul: Reduced tax rates boosted profitability and stock buybacks, fueling index growth.
- Tariffs on China: Heightened uncertainty and retaliatory measures impacted tech and industrial sectors.
2019: Recovery Before the Storm
- Trends: The US-500 advanced as partial trade resolutions and sustained low interest rates fueled renewed confidence.
- Why It Moved:
- Reduced Trade Tensions: Interim agreements with major trading partners prevented deeper market fallout.
- Accommodative Monetary Policy: The Fed’s stance supported continued corporate earnings growth.
2020: Pandemic Shock
- Trends: A swift plunge in March 2020 amid global lockdowns and economic disruptions, followed by a strong rebound thanks to stimulus programs. Tech and online services thrived due to the remote work shift.
- Why It Moved:
- COVID-19 Outbreak: Rapid economic decline led to historic volatility.
- Massive Stimulus: Aggressive monetary and fiscal action stabilized markets and propelled growth stocks.
2021–2022: Inflation Worries and War in Ukraine
- Trends: Early vaccine rollouts supported new record highs, but rising inflation and Russia’s invasion of Ukraine triggered volatility. Energy stocks surged, while tech faced pressure.
- Why It Moved:
- Fed Rate Hikes: Concerns about escalating consumer prices and higher borrowing costs.
- Geopolitical Tensions: The crisis in Ukraine disrupted global supply chains and investor sentiment.
2023–2024: Mixed Recovery
- Trends: Markets regained some stability as companies adapted to higher borrowing costs. Tech and healthcare showed resilience, though lingering inflation and supply chain issues periodically undermined confidence.
- Why It Moved:
- Earnings Resilience: Large-cap companies posted solid results, allaying fears of a deeper downturn.
- Persistent Uncertainties: Continued geopolitical tensions and inflation spikes kept traders watchful.
January 2025: Trump’s Second Inauguration and Fresh Volatility
- Trends: The index dipped amid concerns about renewed tariffs and uncertainty over cross-border energy deals involving Canada. Fears of rising costs in critical sectors dampened investor optimism.
- Why It Moved:
- Aggressive Tariff Rhetoric: Threats of expanded tariffs, including those directed at allies, rattled global markets.
- Energy Disruptions: Potential strains on US-Canada energy ties triggered questions about reliable power supply.
Current Trends and Future Projections
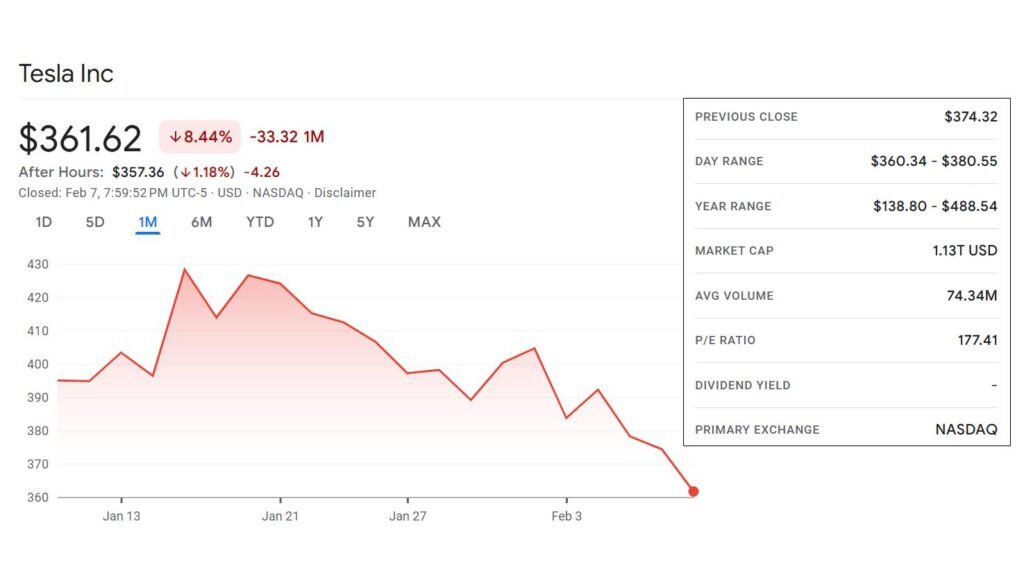
As of March 2025, the US-500 remains highly volatile, struggling to regain stability in the wake of shifting economic policies. Major investment firms have adjusted their outlooks, with many predicting a slower recovery unless clearer economic guidance emerges from the Trump administration. Tech stocks, which thrived during previous years, are under pressure due to fears of stricter regulations and potential anti-China tariffs impacting semiconductor supply chains.
International investors are diversifying their portfolios, with a noticeable shift towards European and Asian markets, reducing dependence on US equities. Additionally, a stronger focus on gold and other safe-haven assets indicates that confidence in the American market is wavering.
What’s Next for the US-500?
The direction of the US-500 in 2025 depends on multiple factors, including Federal Reserve policy decisions, inflation control efforts, and the evolving geopolitical landscape. While some analysts believe that Trump’s policies might boost domestic manufacturing and energy independence, others warn of long-term damage due to weakened international trade relationships.
The question remains: Will the US-500 recover, or are we entering a prolonged period of economic stagnation? We invite you to leave a comment and share your thoughts. Check back with us daily for the latest insights and updates on the US-500 and other critical financial trends. We will continue to analyze this evolving story, providing you with the most in-depth coverage available.

